Basic Visualization (PyMOL)
This page covers molecular visualization capabilities using PyMOL for creating high-quality graphics and interactive session files.
Visualization Jobs
Create static PyMOL visualizations and interactive PSE session files.
chemsmart run [OPTIONS] mol [MOL_OPTIONS] visualize [SUBCMD_OPTIONS]
Visualization Options
Option |
Type |
Description |
|---|---|---|
|
string |
PyMOL style script (default: zhang_group_pymol_style.py) |
|
string |
Render style: pymol or cylview |
|
bool |
Ray trace rendering (default: enabled) |
|
bool |
Add Van der Waals surface (default: disabled) |
|
bool |
Quiet mode (default: disabled) |
|
bool |
Run without GUI (default: enabled) |
|
string |
Coordinates for labeling (1-indexed) |
Basic Usage
Standard visualization:
chemsmart run mol -f molecule.xyz visualize
Quiet mode:
chemsmart run mol -f calculation.log visualize -q
With coordinate labeling:
chemsmart run mol -f structure.xyz visualize -c [[1,2,3]]
Custom style:
chemsmart run mol -f molecule.log visualize -f custom_style.py
Batch visualization from a directory (by file type):
chemsmart run mol -d /path/to/outputs -t log visualize
This creates a single PyMOL session visualizing the last structure of every .log file in the directory.
Batch visualization from a directory (by program):
chemsmart run mol -d /path/to/outputs -p gaussian visualize
This creates a single PyMOL session visualizing the last structure of all Gaussian output files in the directory.
Movie Jobs
Generate rotating movie animations.
chemsmart run [OPTIONS] mol [MOL_OPTIONS] movie [SUBCMD_OPTIONS]
Movie jobs inherit all visualization options.
Basic Usage
chemsmart run mol -f molecule.xyz movie
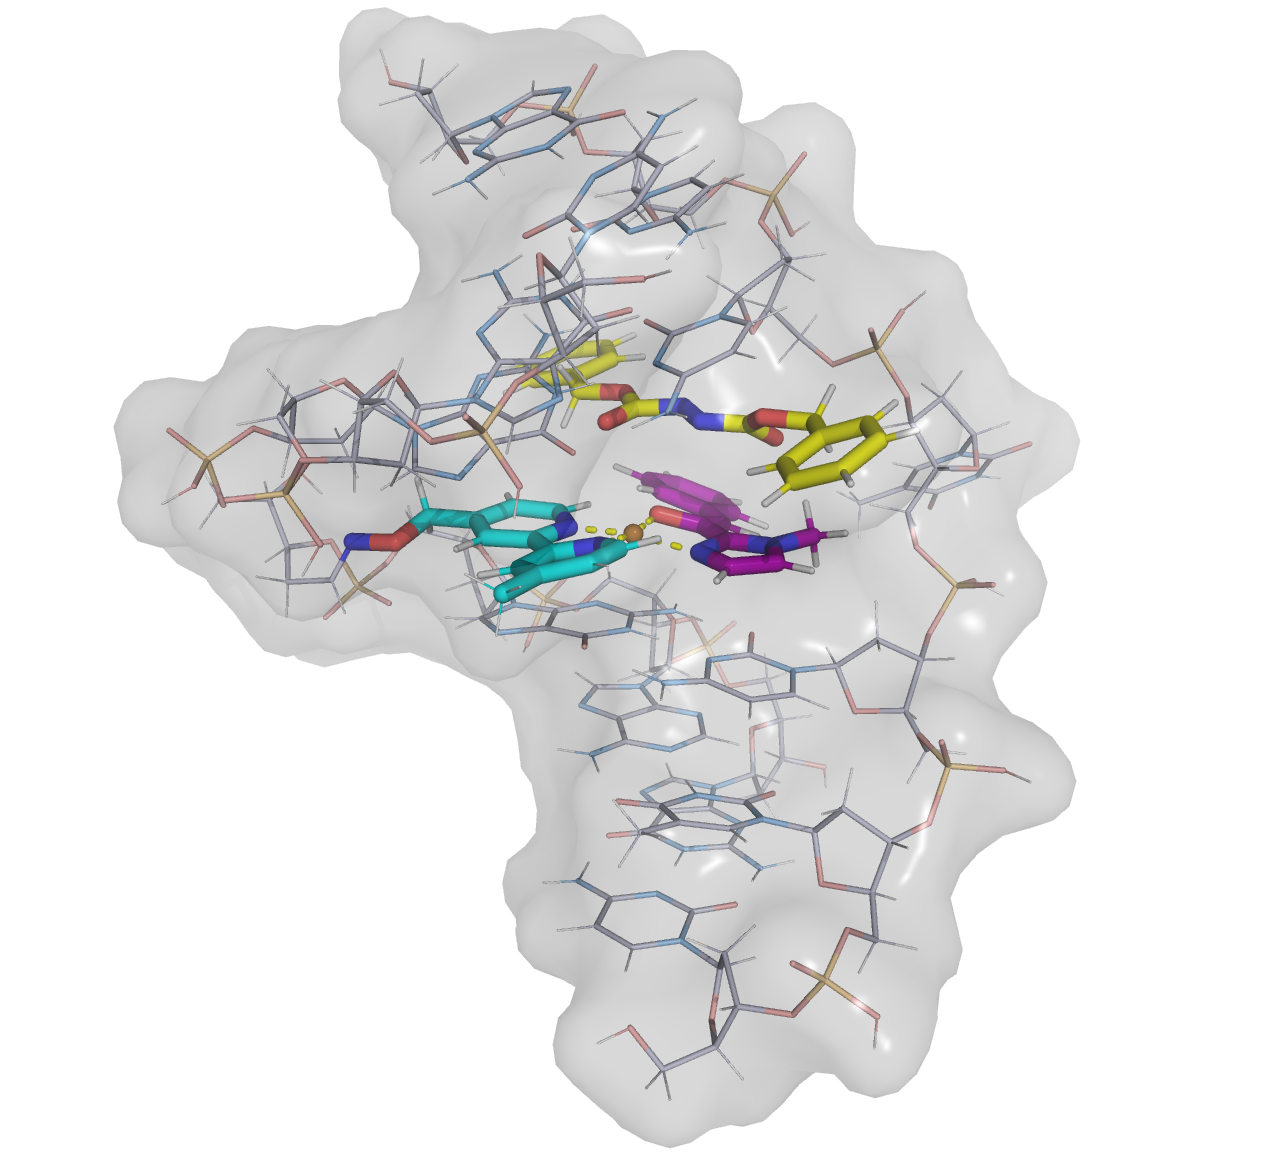
Hybrid Visualization
Create visualizations with different groups displayed in different styles.
chemsmart run [OPTIONS] mol [MOL_OPTIONS] visualize --hybrid [SUBCMD_OPTIONS]
Hybrid Options
Option |
Type |
Description |
|---|---|---|
|
bool |
Enable hybrid visualization mode |
|
string |
Atom indices for a group (repeatable) |
|
string |
Color for each group (repeatable) |
|
string |
Surface color (default: grey) |
|
string |
Surface transparency (default: 0.7) |
|
string |
Carbon atom color (RGB list) |
|
string |
Nitrogen atom color (RGB list) |
|
string |
Oxygen atom color (RGB list) |
Basic Usage
Basic hybrid visualization:
chemsmart run mol -f molecule.xyz visualize --hybrid -G '1,2,3'
Custom colors:
chemsmart run mol -f molecule.log visualize --hybrid -G '1,2,3' -G '4,5,6' -C cbay -C cbak
Custom background settings:
chemsmart run mol -f structure.xyz visualize --hybrid -G '1,2,3' -ST 0.8 -NC '[0.8, 0.8, 0.9]'
Example
chemsmart run mol -f molecule.xyz visualize --hybrid -G '417-418,422-424' -G '336,397-412'
Align Jobs
Align multiple molecular structures for comparison (Alignment reference is the first structure).
chemsmart run [OPTIONS] mol align [SUBCMD_OPTIONS]
Basic Usage
Align multiple files:
chemsmart run mol -f mol1.xyz -f mol2.gjf -f mol3.log -i 1 align
Align all files of the same type:
chemsmart run mol -d . -t xyz -l xyz_alignment align
Note
When using -i n, ensure every input file contains the nth structure. Here -t/--filetype is extension-based:
it filters filenames such as .xyz or .log and does not infer a Gaussian or ORCA program identity.
Align multiple structures in one file:
chemsmart run mol -f conformers.xyz -i 1,3-6,-1 align
Note
If there is no additional index, align all structures in the file by default.